Where gold should be.

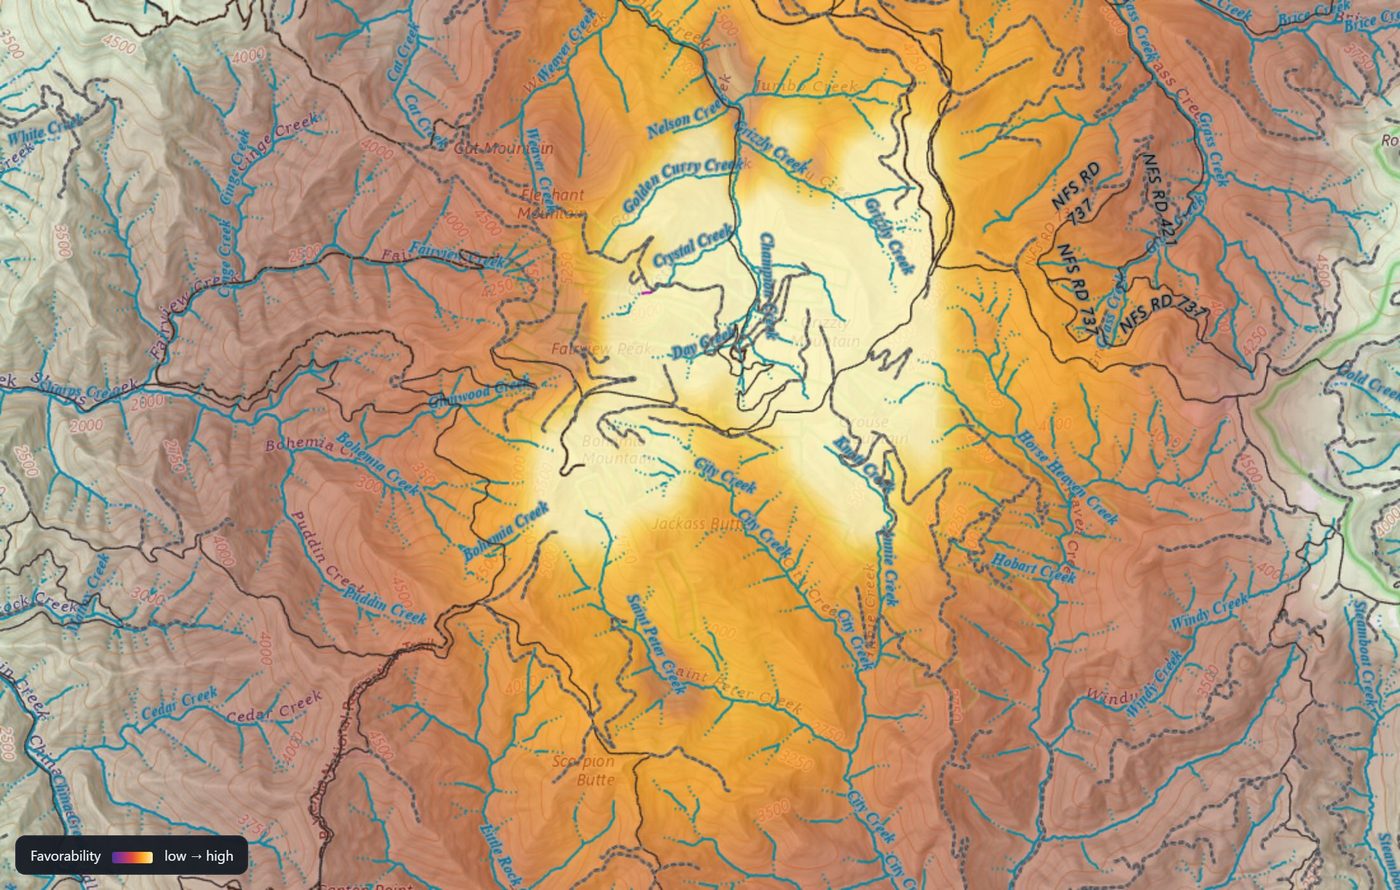
The glow on this map is our Gold Favorability Model — trained on 300,000+ federal mineral records and the geology, wall-to-wall across the West. Every known occurrence, claim, creek and rock unit underneath it. We don't sell the data. We sell the read.

Explore the map → See a sample report →

The idea

Gold leaves a trail. The data to read it is public — it's just unreadable.

THE SOURCE

Where it came from

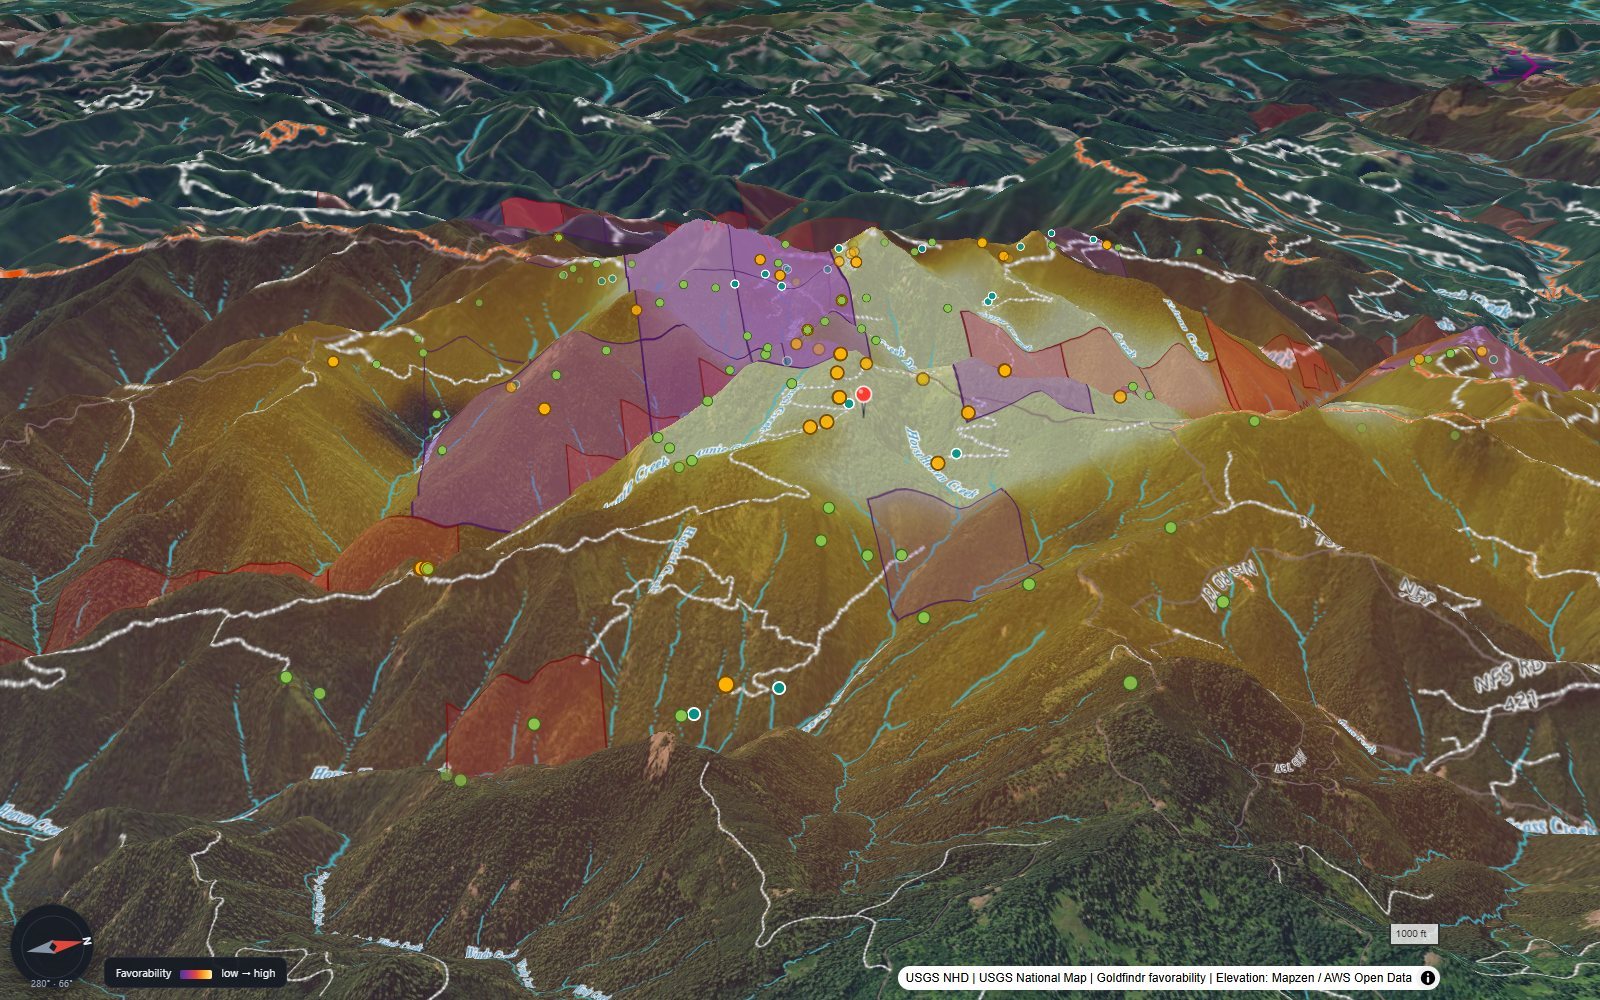
Lode gold sits in the rock up high. We map the known occurrences and the geology that hosts them, so you can see the sources above you.

THE TRAIL

Where it went

Gold weathers out and rides the creeks downhill. Click a source and the drainage below it lights up — the water that carries placer down to where you can pan it.

THE GROUND

Whether you can work it

We overlay active mining claims so you can see what's already taken — and we tell you, plainly, to verify the legal status before you ever dig.

The Gold Favorability Map

A model of the whole West that says, ground by ground: this looks like where gold was found.

We trained a model on 300,000+ federal mineral records and the geologic map — the rock types, the faults, the intrusive contacts, the terrain. Then we tested it the hard way: hide known gold sites, ask the model to find them again. In validated districts it re-finds 52–74% of known gold sites in its top 10–15% of terrain. That heat now drapes the live map — and members can click ANY ground for a read of that exact spot: the model's take, the creeks that drain it, the rock story, who owns it.
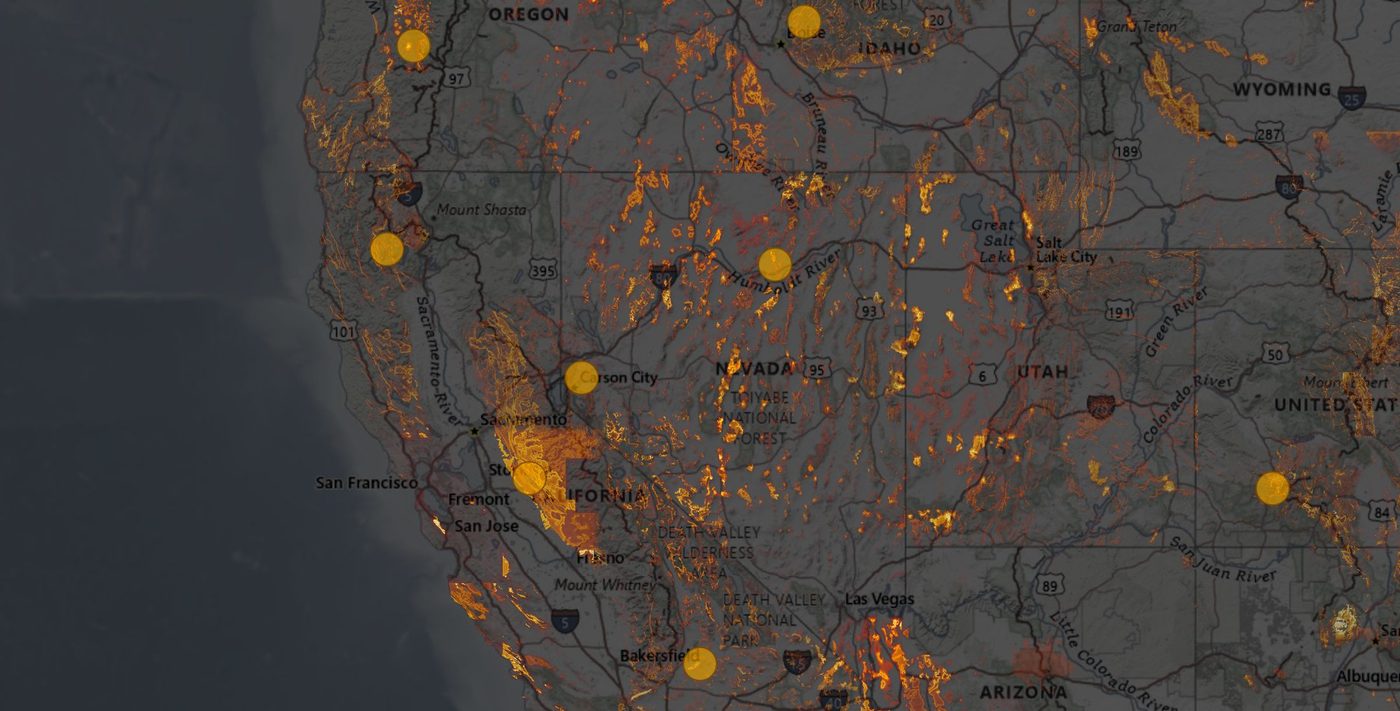
Gold favorability heat across Nevada, California and Oregon

The whole West, one yardstick

Eleven states wall-to-wall. Cold ground is honestly cold — the empty stretches are real.
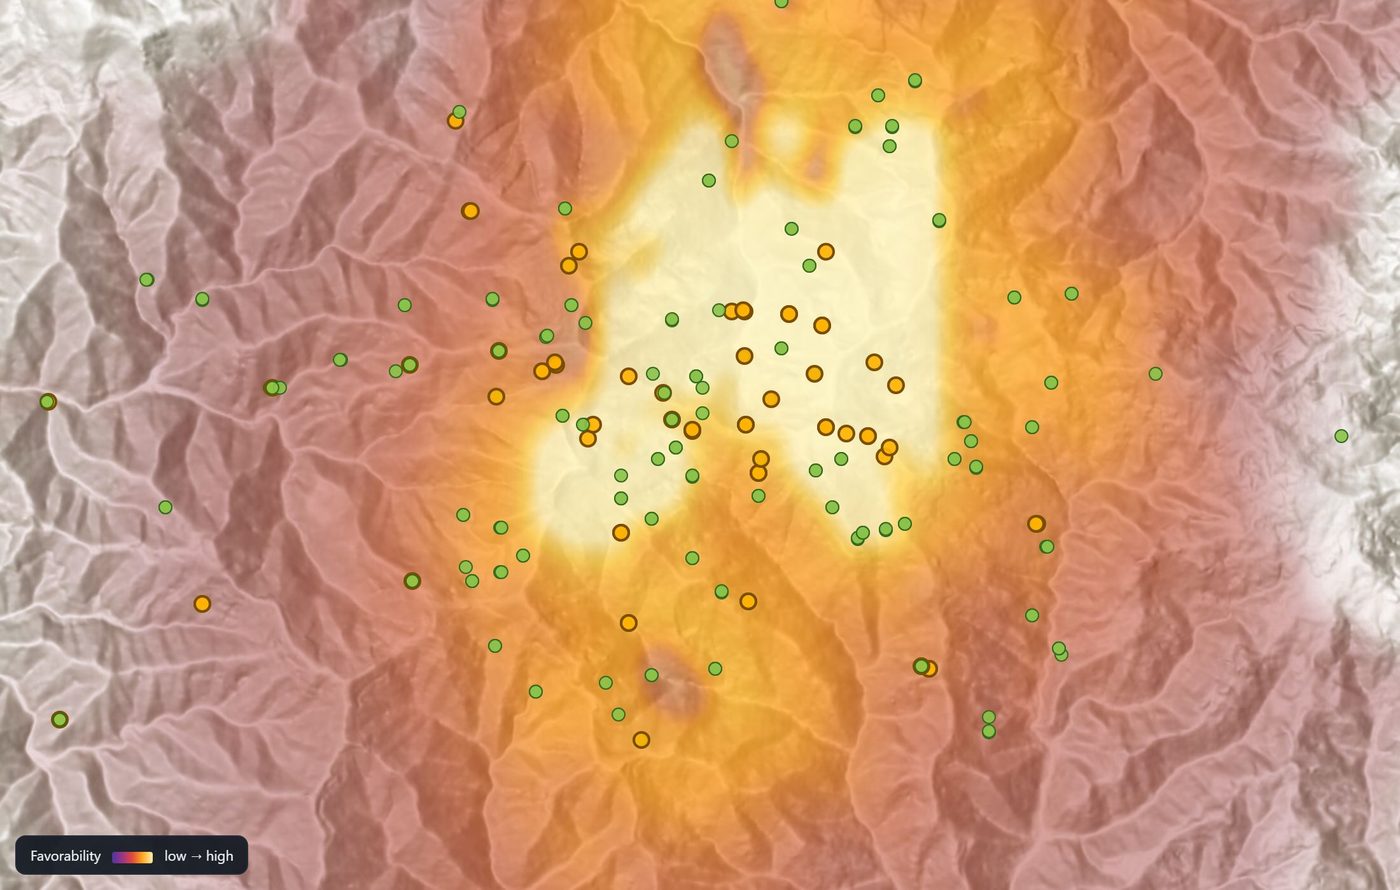
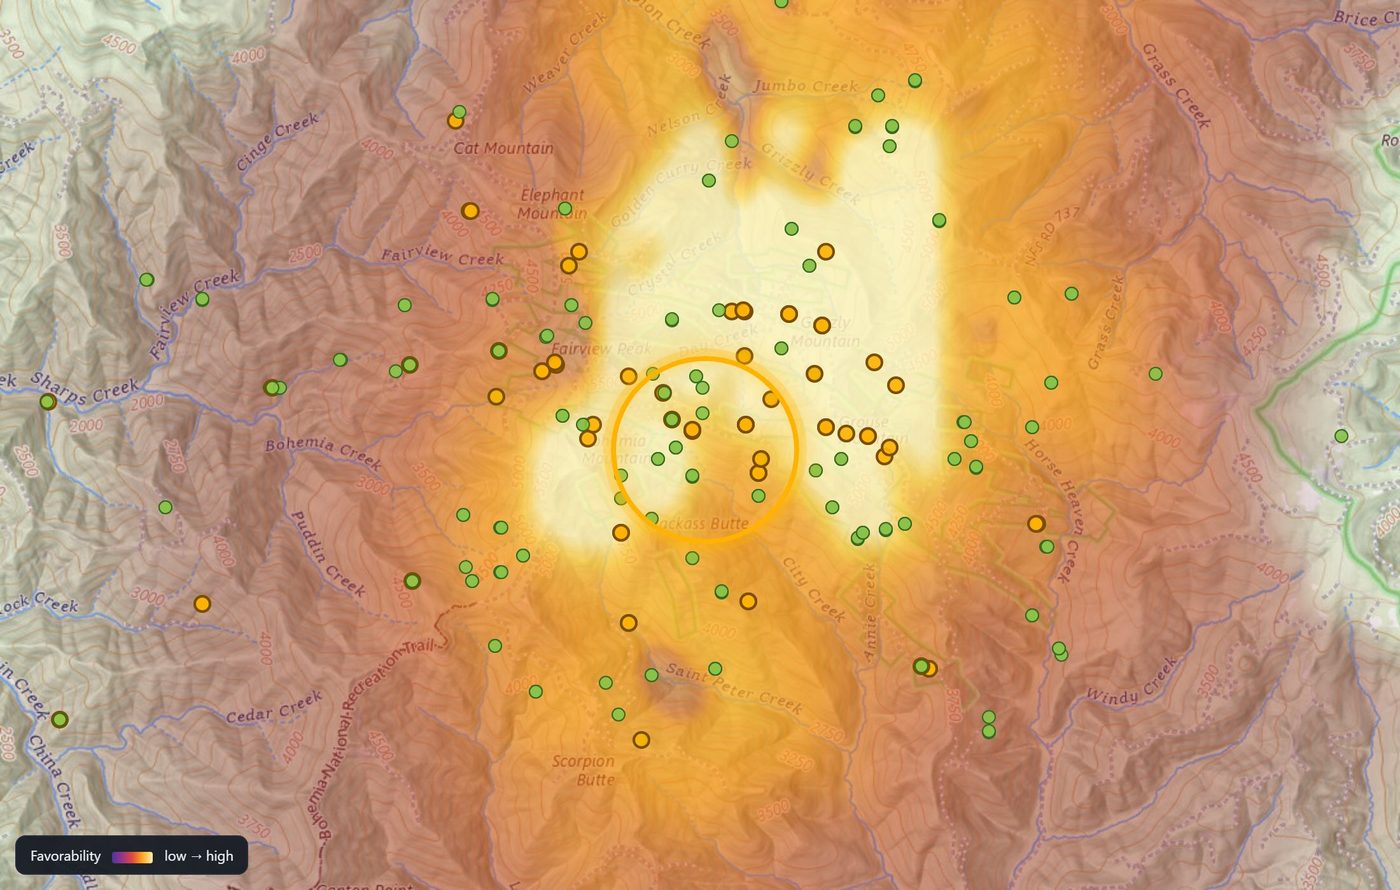
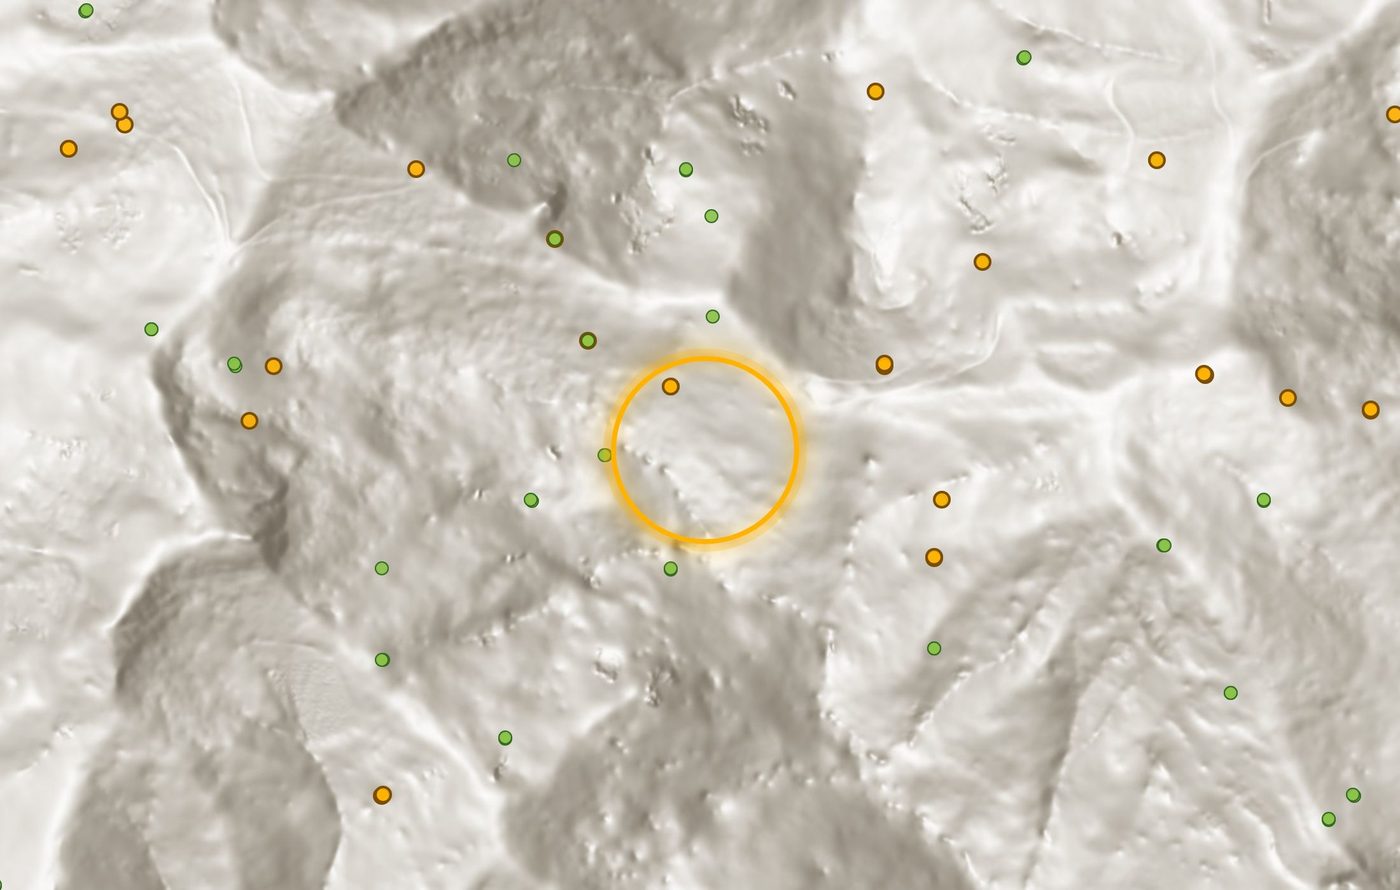
Favorability heat over shaded relief in the Oregon Cascades

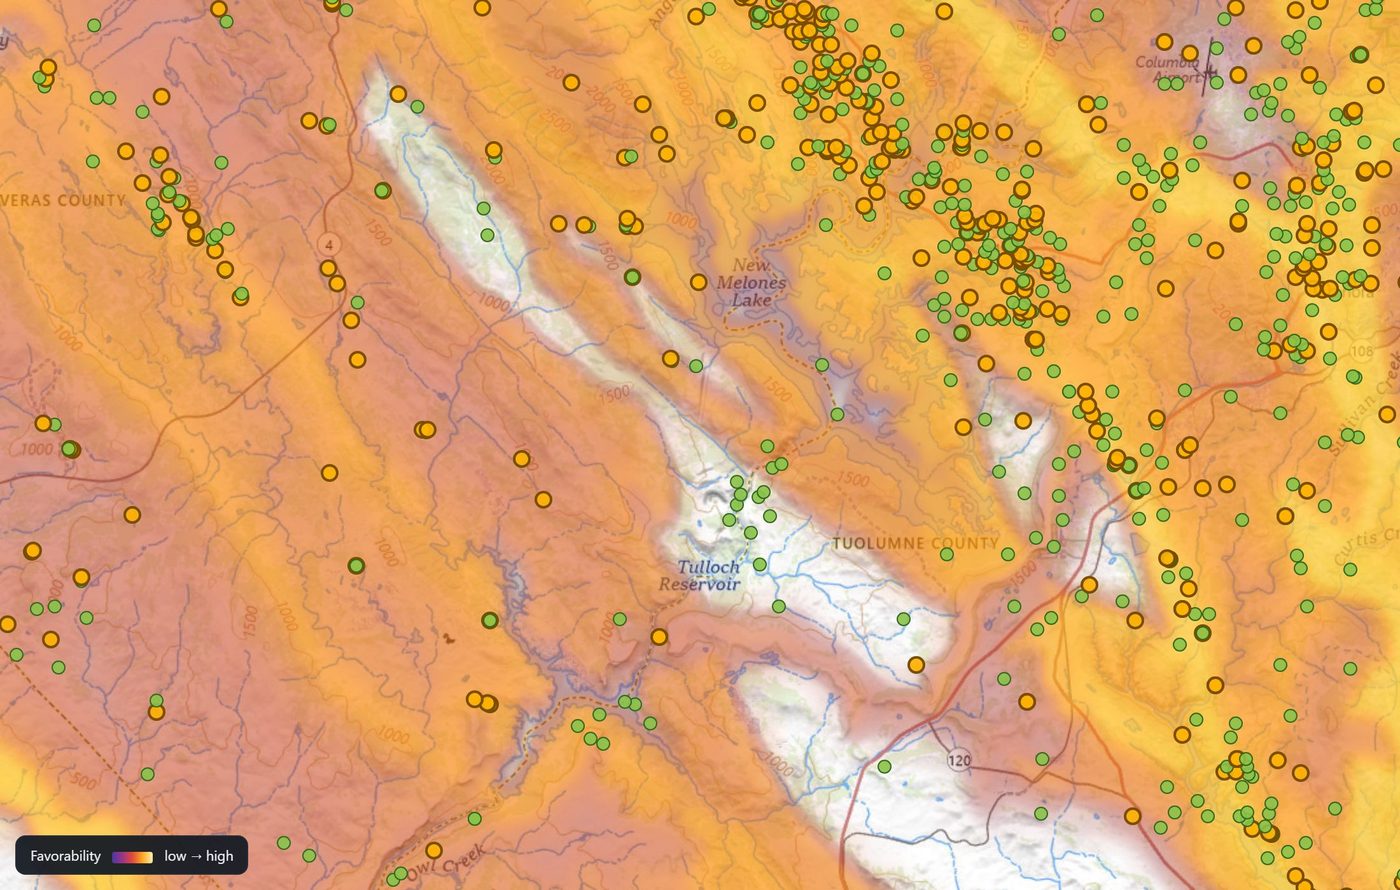
Down to the drainage

Heat over bare-earth relief. This district's model re-found 54–57% of its known sites in the top 10% of terrain.

Favorability heat in central Nevada gold country

Validated, district by district

Central Nevada's model re-found 74% of known sites in its top 10% — the map tells you where it's been proven.

See it live on the map →

Pricing

Start free. Become a member when you want the verdict.

Free
$0
  • Explore the whole West on one map
  • The Gold Favorability Map at overview zooms
  • Every known gold occurrence + active claims
  • No account, no card, no time limit
Open the map
Membership first 7 days free
$10/mo · or $90/year — save 25%
  • The Gold Favorability Map at full detail, every zoom
  • Spot reports — click any spot for the full read: drainage, known sources nearest first, geology, claim status and how to get there
  • Ground reads — click ANY spot for the expert read
  • Land ownership — public tint + private-land hatch
  • Bare-earth LiDAR — old workings under the trees
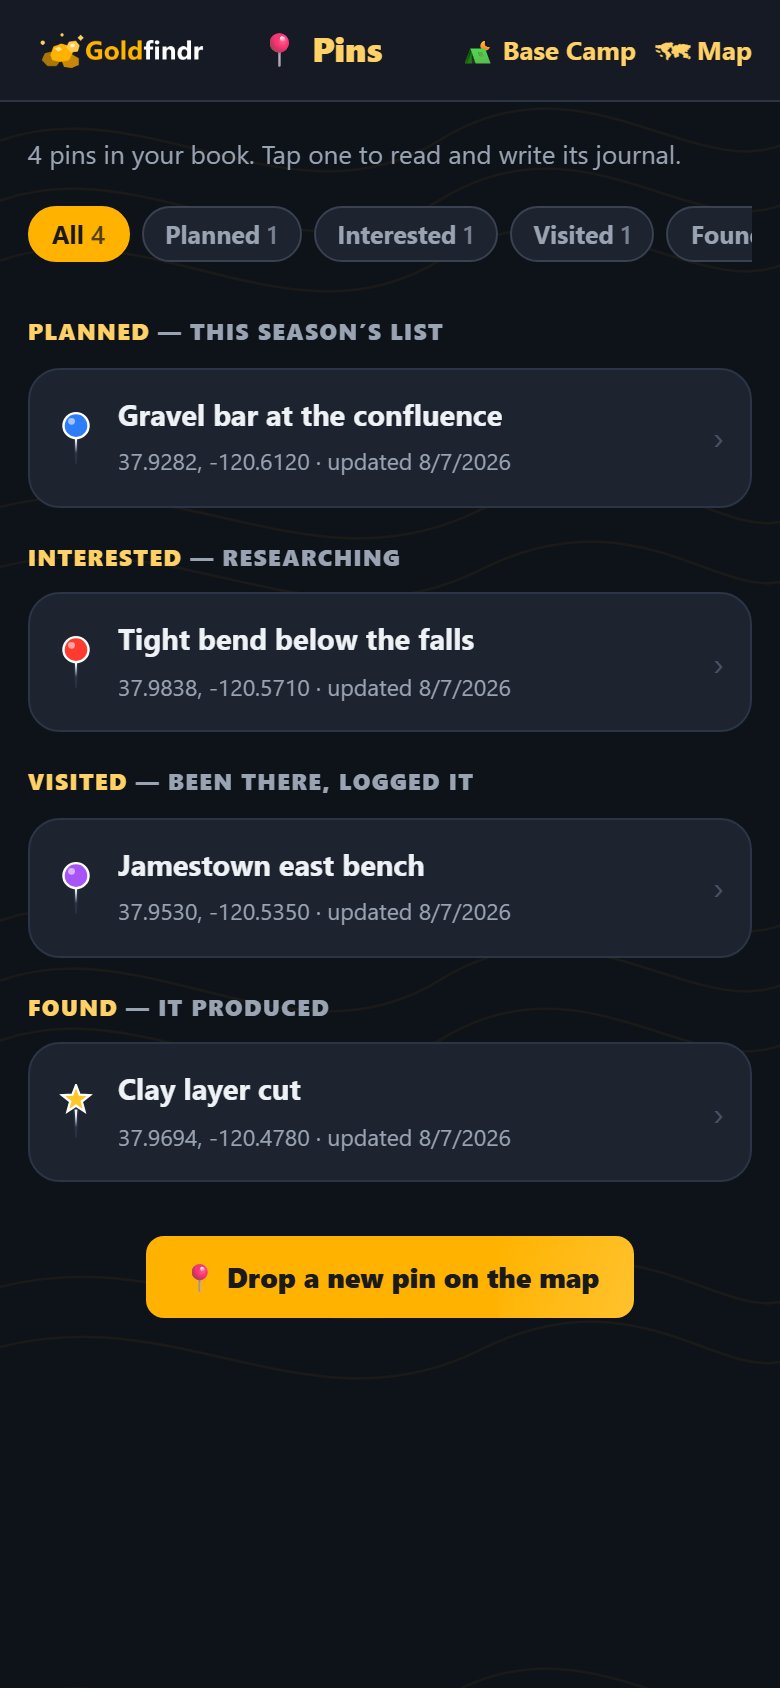
  • Pins & a prospecting journal: press and hold to pin your spots, walk each one from interested to found — your private book, saved to your membership
Start your free week → or preview a sample spot report →

About half what one streaming subscription costs — for every gold-bearing county in the West, on one map.

Cancel anytime — nothing is charged for the first 7 days. $50 / 6 months also available.

Gold by state

The public gold record, state by state

Every documented gold occurrence, producer and placer district in the federal record — mapped and readable for free:

California Oregon Washington Idaho Nevada Arizona Utah Colorado Montana Wyoming New Mexico

Goldfindr is information, not advice, and is not a legal survey. Mineral, claim and land data come from public sources (USGS, BLM) that lag and are approximate — always verify a site's claim and land status with BLM MLRS and the county, and confirm legal access, before prospecting. Know the terrain, the weather and your own limits.
© Goldfindr, a VentureOS LLC product · Terms of Service · Privacy Policy · tim@goldfindr.app